
Statistics Monitoring at Ruk-Com Cloud
This guide is maintained for Ruk-Com PaaS. Screens and options may vary by platform version and account permissions.
Confirm the environment, region and account permissions, and back up current settings before changing a production system.
Objective
This guide explains how to use Statistics Monitoring at Ruk-Com Cloud on Ruk-Com Cloud PaaS, with ordered procedures and practical verification points.
Before you begin
- Sign in with an account permitted to manage the relevant environment.
- Confirm the target environment, region and resources before saving changes.
- Create a backup or rollback plan before changing a production system.
Statistics monitoring is a simple yet powerful tool that helps in intelligently managing the environment. The information received from the statistics module covers all billable resource usage. Therefore, it can help adjust the topology according to your needs and reduce costs significantly.
Viewing statistics
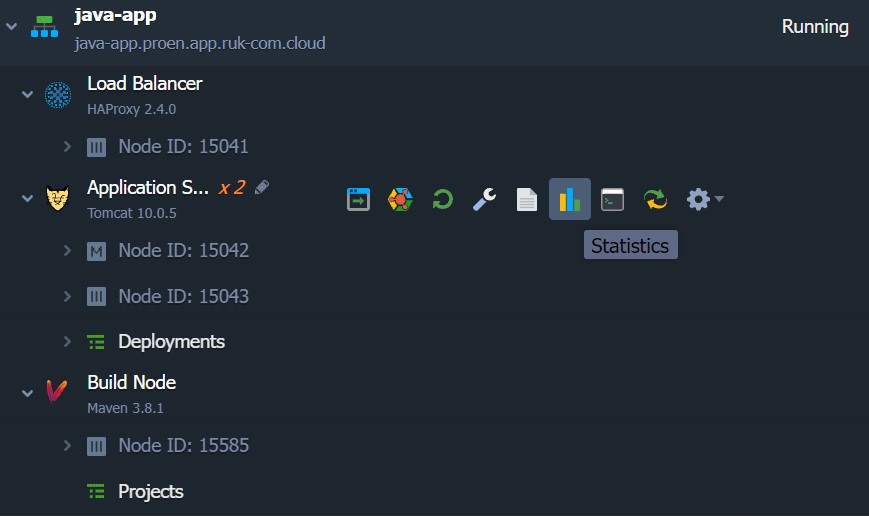
You can track usage statistics for all nodes in your environment: application servers, balancers, web servers, and databases. Just click the corresponding button next to the desired instance. (or set of instances of the same type):
In the tab that opens You will find statistics about all types of resource usage and limits:
- RAM- Memory usage (unitsMb)
- CPU- Processor load (unitMhz)
- Network- Internal and external data transmission (unitMb)
- Disk- Amount of stored data (unitMb) and I/O operation volume (unitIOPS)
limitRAMandCPUThis depends on the number of cloudlets you allocate for each node. As determined by your hosting providerNetwork DiskandIOPS
You can further analyze the presented statistics by changing the interval and duration settings. And turn on/off specific sections in the top toolbar:
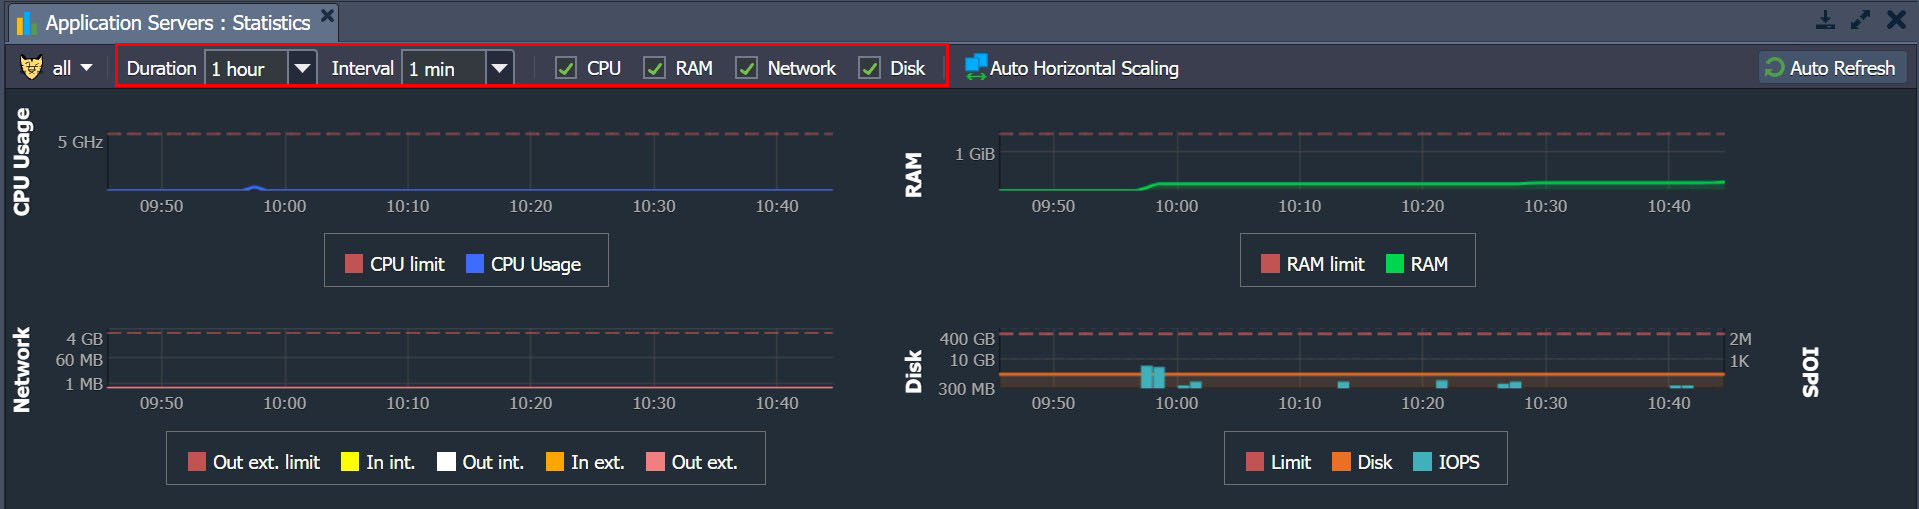
Note:Ruk-Com Cloud PaaS collects statistics every minute and stores them for one hour to use the "on-demand" billing method.Pay-per-Usethat is correct and precise After that, data is automatically collected in one-hour blocks using one of two methods based on the specific type of resource:
- Sum of all values of CPU, Network, Disk IOPS and Disk IO.
- Maximum values for RAM and Disk
Using statistical data, you can easily track application resource usage. (Hover to view details in a particular time frame) It is possible to analyze and predict future spending and hence you can choose the best way to manage your environment. For more convenience, you can configureload alertsTo notify about the growth of consumption level or decrease by a specified percentage by email, which will help you save a lot of money.
See documentation links for additional information.Resource billing
And below we'll look at the specifics of tracking I/O usage in more detail.
Monitoring I/O usage
Quantity inspectionInput/Output operations per secondIt is a very common and popular storage measurement method that helps analyze the performance of a container based on its ability to handle a number of read and write operations simultaneously without degrading performance.
Note:There are currently no IOPS statistics available for Windows-based nodes.
1. IOPS information is displayed in theDiskstatistics
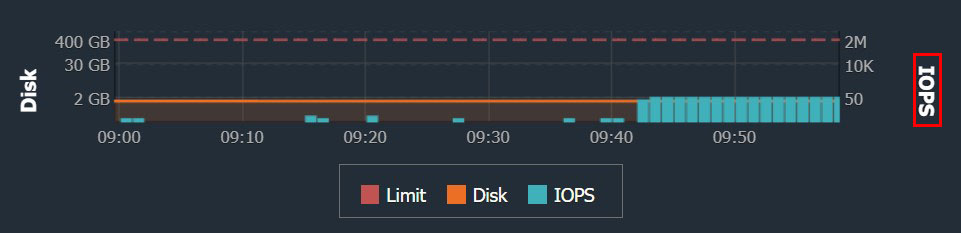
Here it is clear that the more operations are performed, the more burden the system has.system loadIt's only going to be more. Therefore, to avoid hardware performance degradation, the allowed number of IOPS is limited to a reasonable value. (Determined by your hosting provider) is marked with a red dotted line at the top of the graph.
If it gets to this point, it means that your container's performance may be negatively affected, thus it becomes necessary to expand the number of servers used to optimize the application.
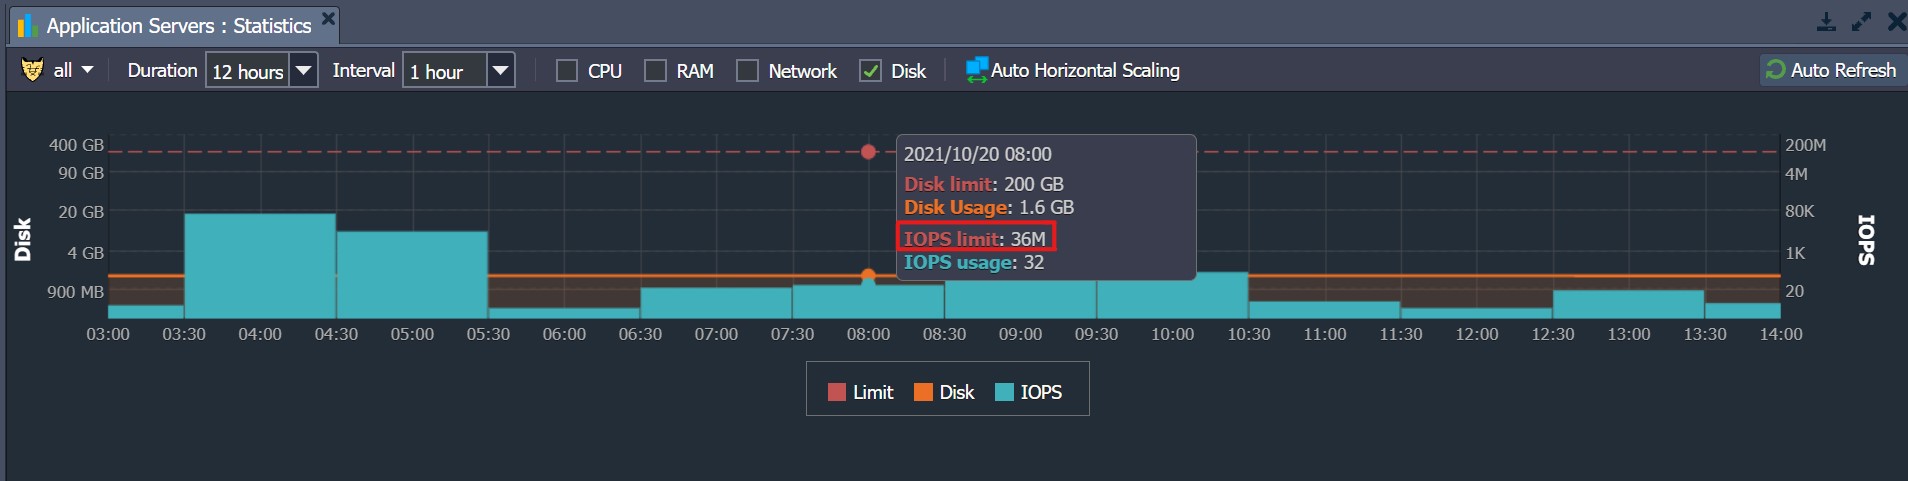
2. When you hover your mouse over a point on the Disk/IOPS graph, you will see a pop-up tip with the following details.
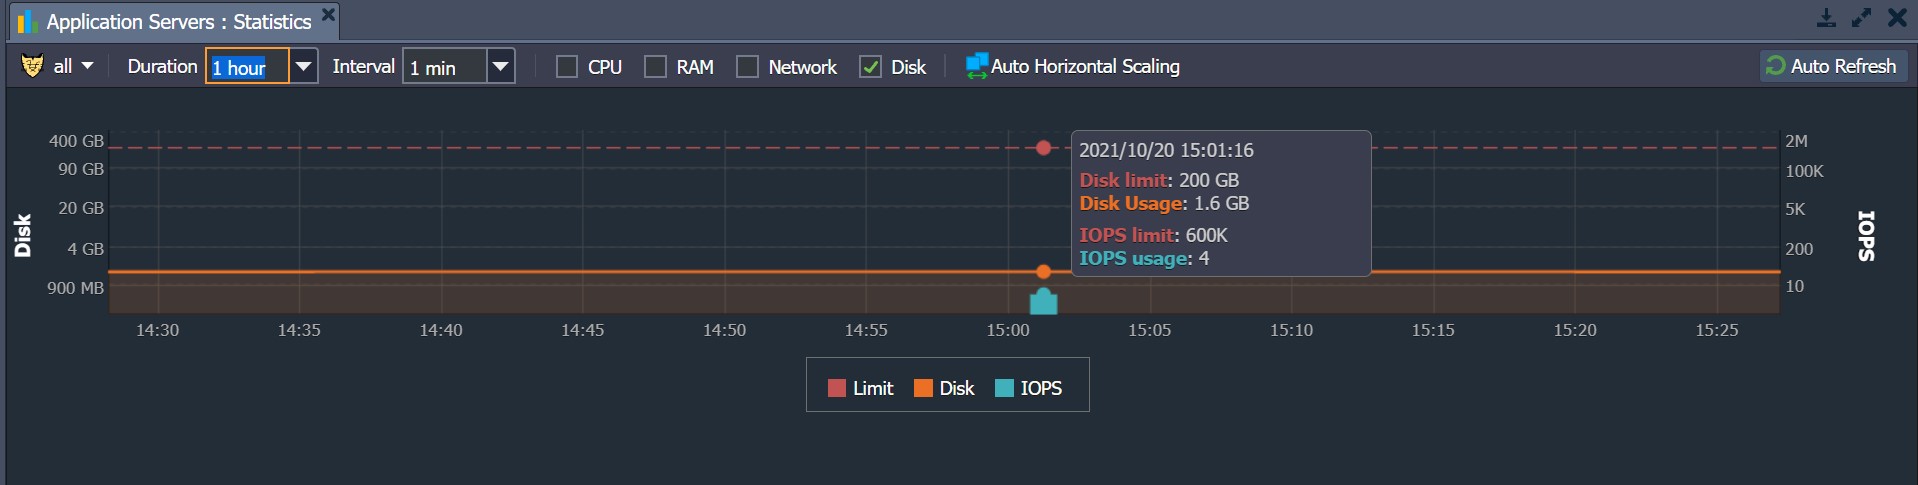
- The date and time the statistics were collected.
- Disk limit- Maximum amount of data allowed to be stored in the container.
- Disk Usage- Amount of container space actually used
- IOPS limit- The maximum number of I/O operations allowed by the container during the specified time period.
- IOPS Usage- Number of I/O operations performed during the specified time period.
Note:Both limits (e.g.disk spaceandIOPS) will display only one line.LimitIn this legend are the specific limit values for each type of resource. You can see on the right axes - both left and right - for used disk space and amount.IOPSrespectively
3. As mentioned above, the IOPS limit depends on the time period selected. For example, if you specify a time period of 1 hour for your environment, the limit previously equal to 1 minute (which would have been 600000 - pictured in the previous step) will be increased by a factor of 60 (1 hour equals 60 minutes):
600000 * 60 = 36000000
This way you will get real disk load information and can check the status at any time.