
OpenSearch Auto-Clustering
This guide is maintained for Ruk-Com PaaS. Screens and options may vary by platform version and account permissions.
Confirm the environment, region and account permissions, and back up current settings before changing a production system.
The OpenSearch Cluster is a community-driven, open-source search and analytics engine. It is suited for application search and log analytics, where you need to search, aggregate, view, and analyze data. You can modify and extend OpenSearch with additional functionality.
OpenSearch is derived from Apache 2.0 licensed Elasticsearch 7.10.2, allowing the product to be freely used, modified, extended, monetized, and resold.
This guide provides information on:
- OpenSearch Cluster Components Overview
- OpenSearch Cluster Installation
- OpenSearch vs Elasticsearch Performance
OpenSearch Cluster Components Overview
The platform provides OpenSearch Cluster using three certified stacks united into a single auto-clustering solution:
- OpenSearch - a community-driven, open-source search engine that provides a distributed, multitenant-capable full-text search
- OpenSearch Dashboards (optional) - visualization for data stored inside the OpenSearch nodes (derived from Kibana 7.10.2)
- Logstash (optional) - data processing
Tip: The Beats add-on can be installed for single-purpose data shippers that send data from the client nodes to Logstash or OpenSearch.
In such a solution, data is gathered on client nodes by Beats data shippers, sent to Logstash (which transforms it as needed), and stored in OpenSearch. OpenSearch Dashboards is the supplementary visualization tool.
OpenSearch
The OpenSearch stack is the core and the only mandatory component of the cluster. It is initialized in the cluster mode even when a single node is created, which makes horizontal scaling easier, faster, and safer.
After being created, the OpenSearch node is available on port 9200 for internal communication between nodes of the environment. Through the shared load balancer, external access uses port 4848 (HTTPS) or 4949 (HTTP), depending on the plugins.security.ssl.http.enabled setting in opensearch.yml. HTTP basic authentication is used in both cases (password can be reset using the Reset Password button).
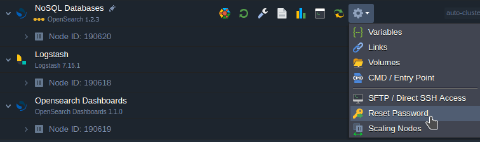 The OpenSearch stack benefits from all the functionality available for other certified templates - dashboard file manager, Web SSH, dashboard log viewer, etc.
Also, the platform’s redeploy functionality provides a simple update process. However, only redeployment to the same or newer version is allowed - a downgrade is restricted.
OpenSearch Dashboards
The OpenSearch node is available via a browser, but it only shows the JSON with an API response (required for API calls). The main tool for visualizing the data is OpenSearch Dashboards (a replacement for Kibana). All the interconnection configurations are done automatically - the solution is ready to use out of the box and does not need any manual configuration. Access is available by the same credentials as for the OpenSearch node.
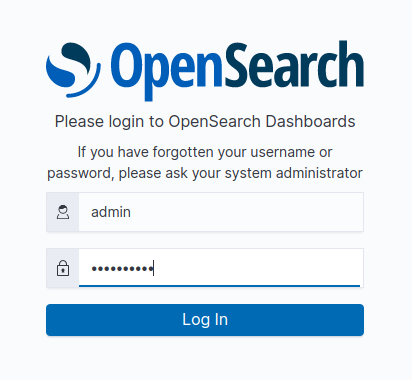 After logging in, the OpenSearch Dashboards interface is displayed. The dashboard provides a UI for convenient interaction with the OpenSearch API and editing your data (after creating the index pattern).
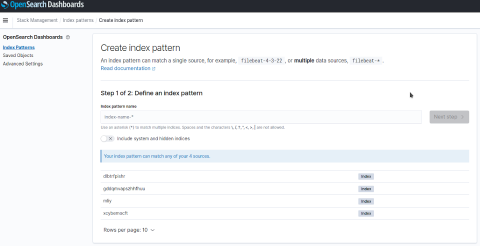
Note:OpenSearch Dashboards is not a separate stack and cannot be created separately from OpenSearch. Also, it is limited to one node as scaling provides no additional benefits.
All the regular functionality of certified templates (dashboard file manager, Web SSH, firewall, logs) is also available for this node.
Logstash
Logstash is a data processor component of the OpenSearch cluster that is automatically configured by the platform. Below, you can see an example of default auto-configuration for /etc/logstash/conf.d/logstash-sample.conf:
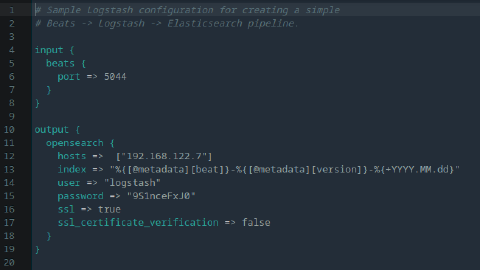 The input for Beats is assigned on port 5044, and the OpenSearch output is specified by setting the hosts, username, and password for interconnection. Plugins for other types of inputs can be installed with the
 logstash-plugin tool, and configs can be added to the same file (with another port).
Note:Logstash is not a separate stack and cannot be created separately from OpenSearch. You can add as many Logstash nodes as needed - scaling is in stateful mode to provide initial configs. However, each node can be reconfigured for different data transformations.
Beats Add-On
Beats is a free and open platform for single-purpose data shippers. They send data from the client nodes to Logstash or OpenSearch.
- 7.12.1 - to ship data directly to OpenSearch (see compatibility charts)
Note: For direct connection, you need to add the following line to the OpenSearch config and restart the node:
yaml Copy
compatibility.override_main_response_version: true
- latest - to ship data to OpenSearch through Logstash
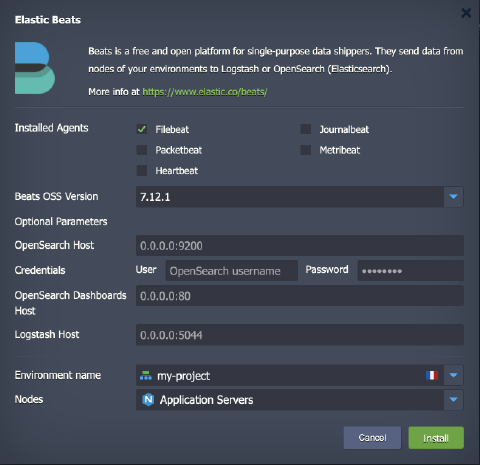 During installation, you need to provide the following data:
-
Installed Agents - choose the required Beats types:
- Filebeat - forwards and centralizes logs and files. Pre-sets are already available for many certified nodes: Apache (all), NGINX (all), HAProxy, Redis, Postgres, MySQL, MariaDB, Percona. Tomcat/TomEE requires special configurations.
- Metricbeat - collects metrics from your systems and services.
- Journalbeat - forwards and centralizes log data from systemd journals. Installed as an agent on your servers, Journalbeat monitors the journal locations that you specify, collects log events, and forwards them to OpenSearch or Logstash.
- Packetbeat - monitors your network traffic to ensure a high level of performance and security. Packetbeat is a lightweight network packet analyzer.
- Heartbeat - monitors services for their availability with active probing. It checks response time and if the given URLs are alive, then ships this information to other stacks for further analysis.
-
Beats OSS Version - choose the desired version of the agent
- OpenSearch Host - enter the OpenSearch (or Elasticsearch) host
- Credentials - provide access information for the specified OpenSearch host (User and Password)
- OpenSearch Dashboards Host - enter the OpenSearch Dashboards host (may be needed for visualization purposes)
- Logstash Host - enter the Logstash host (if interconnection is done through Logstash)
Note: Simultaneously sending data to OpenSearch and Logstash outputs is not supported - only one output can be used at once. If you want to pass the data through Logstash, specify only the Logstash host and port (the OpenSearch host and credentials data is not needed).
- Environment name - choose the target environment
- Nodes - choose the target layer
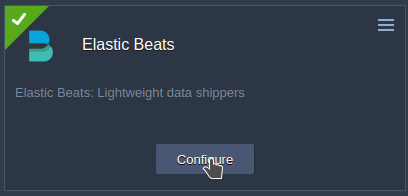
These settings can also be edited for the already installed add-on using the Configure button.
OpenSearch Cluster Installation
You can create an OpenSearch Cluster directly from the topology wizard. The process is fully automated.
Select the OpenSearch stack in the NoSQL database section.
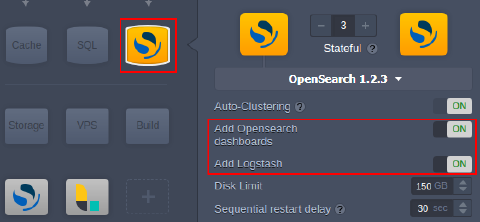 The stack is automatically configured as a cluster due to the auto-clustering feature. You also have additional options to add the OpenSearch Dashboards and Logstash components.
OpenSearch vs Elasticsearch Performance
The OpenSearch project was forked from the last Elasticsearch release under the Apache 2.0 license and is almost the same in functionality. The API is completely the same.
Below are the results of a performance test on two Magento environments with the same topology:
- Magento with Elasticsearch
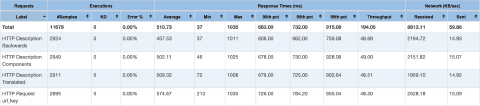 * Magento with OpenSearch
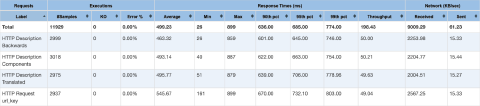 OpenSearch provides the same functionality and performance as Elasticsearch and can be used as a replacement.