
Load Alerts
This guide is maintained for Ruk-Com PaaS. Screens and options may vary by platform version and account permissions.
Confirm the environment, region and account permissions, and back up current settings before changing a production system.
While creating an environment, you state the cloudlet limits for each node. In such a way, the resources are limited and the spends are regulated. When the traffic grows an application requests more resources for normal work. And, if the limits are too low, this can lead to degradation of the application performance.
To monitor your application’s load and the amount of resources it requires, you can configure a set of automatic notification triggers. They are executed if the usage of a particular resource type is above/below the stated value (%) during the appropriate time period. As a result, you’ll get an email notification about your application’s load change.
By default, each container is created with a set of pre-configured load alerts, so you’ll receive the appropriate notifications automatically. If needed, any of them can be easily adjusted or disabled, as well as new triggers can be added.
Create Alert
In order to configure an alert, follow the next instruction:
- Click the Settings button for the desired environment:
 2. In the opened tab, navigate to the Monitoring > Load Alerts section:
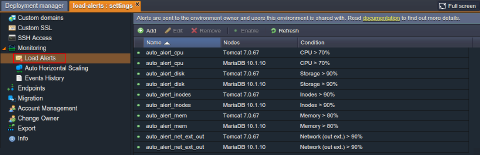 Here, if such is stated within your hosting service provider’s settings, you can find a bunch of default triggers, which are automatically added during environment creation. These ones, if exist, are to notify you when the RAM, CPU, disk, inodes or network traffic usage at any node is coming close to current resource limits (according to the predefined by hoster levels of consumption for notification).
- Using the buttons in the tool panel, you can either Add a new alert or Edit, Remove, Enable/Disable the already existing ones (including the default triggers set). Also, alerts list can be Refreshed using the corresponding button.
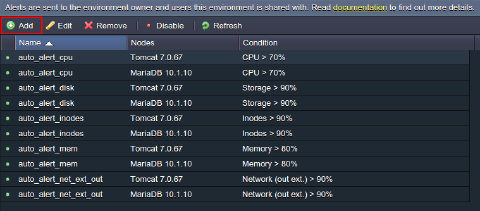 Let’s consider a case of setting up your own trigger - for that, click on the Add button, circled in the image above.
- In the opened Add alert frame, define the following values:
- Name - name of the notification trigger
- Nodes - type of the environment’s node (you can apply trigger to any node within the chosen environment)
- Whenever - type of resources that will be monitored by trigger: Cloudlets (Memory, CPU), Memory, CPU, Network (out ext. + in ext.), Network (out ext.), Storage (disk space amount), Disk I/O, Disk IOPS and Inodes
- Is - condition for trigger invocation/execution, due to which the resource consumption should be above or below (the “>” or “<” values correspondingly - use the first combo-box) of the stated percentage or Mbps for the Network monitoring
- For at least - time period before trigger execution, during which it should remains invoked
- Notification frequency - delay for the repetitive message to be sent
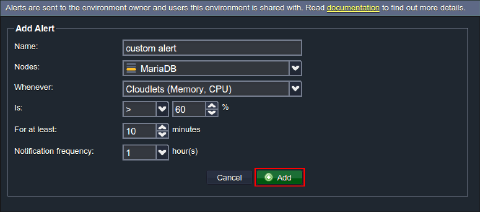 After you’ve stated all the preferable configurations, click Add button.
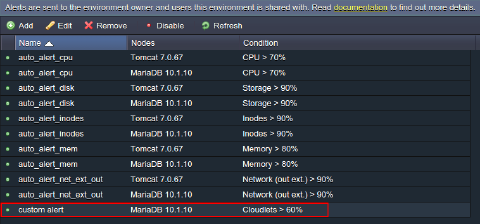
- As soon as alert is configured and activated, it will appear within list with the name you’ve specified in the previous step.
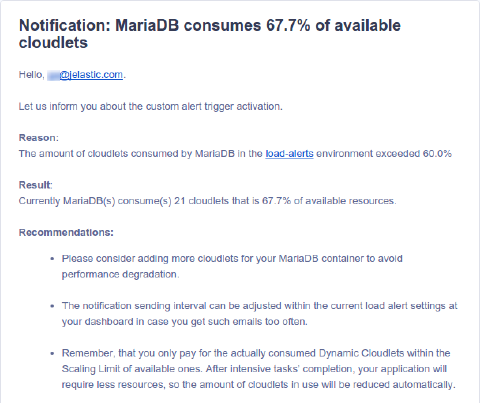
 6. As a result, every time the resource usage comes above/below the stated percentage (depending on the condition stated) during the specified time period, the system will send you an email notification with the current level of consumption, some recommendations on this issue and direct link for the node’s scaling limit adjustment:
Note: that if an environment is shared with other users, they will also receive the same preconfigured load notifications via their emails.
In this way, you can set up a number of different triggers for any existing node in your environment.
Triggers Execution History
You can view the history of triggers’ executions for the nodes of a particular environment within its settings.
- Navigate to the Monitoring > Events History section. The Load Alerts notification Type will be chosen automatically (whilst the second option in the appropriate list is devoted to auto horizontal scaling history).
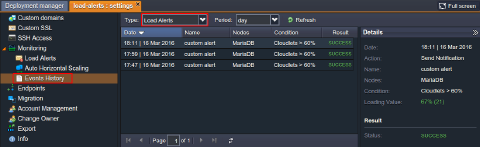 2. Using the Period drop-down list, define the time interval you’d like to view the alerts for. The available values are: day, week, month and custom (where the last one allows to specify the required dates manually).
 3. As a result, you’ll see the list of alerts, that were activated during the stated period. It includes information on:
- Date and time when a trigger has been invoked
- Name of the activated alert
- Nodes type the alert has been configured for
- Condition of alert activation
- Result of the alert (success or failure, i.e., whether notification has been sent or not)
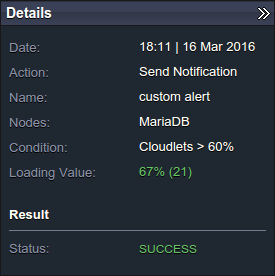
- Click on a particular load alert to see its Details to the right. This pane contains some additional information:
- Loading Value - resource usage level for the time of alert activation, with the amount of consumed cloudlets in brackets
- Action - operation, that has been performed after alert activation (Send Notification in this case)
 In such a way, you can configure a set of alerts and to be sure that the platform will inform you about your application load changes.